 Ubuntu Phone documentation
Platform guides - performance
The SDK and Unity teams are constantly looking for ways to improve the overall performance and battery life of Ubuntu. Your app should be written in the same spirit: lightweight and fast.
This article will show you how to measure performance in your QML app and give you some tips on common pitfalls and resource hogs.
Measuring: how does my app perform?
Let’s start with an important truth: if you want your animations and transitions to look natural and smooth, your application will need to render each frame in less than 16ms (~60fps).
This can be a challenge if you are trying to do many things at the same time. The good news is: the SDK gives you tools to measure and track the cause of your slow-downs.
Meet the Performance overlay
Adding the performance overlay to your application will help you see if it’s slower than it should:
import Ubuntu.PerformanceMetrics 0.1 PerformanceOverlay { active: true }
You now have a new piece of UI floating above your app, don’t worry you can move it around. The top pane of the overlay shows the frame rendering time, the CPU usage is at the bottom.
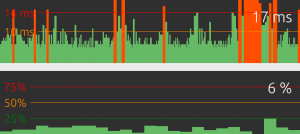
Interact with your app and perform common actions… Each time you end up in the red, there is something you need to optimize! (like this app that obviously needs more work before being released…)


Profiler
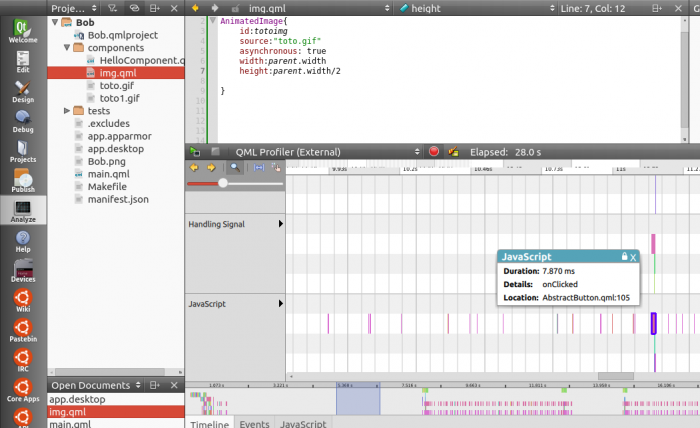
When you have identified an issue, but are not sure which part of your code is causing it, the profiler is a fantastic tool to show you what’s going wrong:
- Go to the “Analyze” pane of the SDK and start your application from it.
- Reproduce the problematic event
- Stop the application and wait for the profile to load
For each event, it provides creating and painting time, javascript functions and specific QML objects performance.
Best practices for optimum performance
Metrics will help you identify the performance bottlenecks and fix them, but following best practices will help you avoiding them in the first place. Here are some tips.
Stay available
- Make long-running tasks asynchronous. To keep your app responsive and available at all times, make sure long running or potentially blocking events are handled asynchronously. A high CPU usage can often delay the rendering of your app.
- Make your app start fast. This seems obvious, but to improve loading time, only load the bare minimum at startup. For that, you are going to use and love Loaders, which we are going to talk about in a moment…
Divide your UI into multiple QML files
Avoid using one large QML file. Think object-oriented and put each logical entity in a separate file you will import in your main scene. This is necessary to unload components when you don’t need them anymore.
Use Loaders
Use Loaders to dynamically load and unload UI components. They will dramatically lower the CPU usage of your app.
To load a component, set the source of your loader to the qml file you need, for example :
Item { width: 200; height: 200 Loader { id: pageLoader } MouseArea { anchors.fill: parent onClicked: pageLoader.source = "Page1.qml" } }
To unload the component, simply set pageLoader.source to an empty string.
Below, you can see how hiding a GIF keeps consuming CPU as opposed to unloading it.
To learn more about it, have a look at the Loaders documentation.
Common resource hogs
Complexity in code is often the cost of great apps, but keep in mind that something that is going to be repeated often needs to be cheap to execute. Splitting your code into logical blocks in independent QML files is a good way to keep track of complex and expensive components.
Images
They are often the greatest memory hogs, let’s see how to handle them:
- Avoid scaling and resizing images. Don’t hesitate to use multiple sizes of your assets and declare their exact dimensions.
- Load large images asynchronously, the UI will stay responsive while loading them. Note that this is only needed for local resources, network images are always lazy-loaded.
Image {
    source: “largefile.jpg”
    asynchronous: true
}
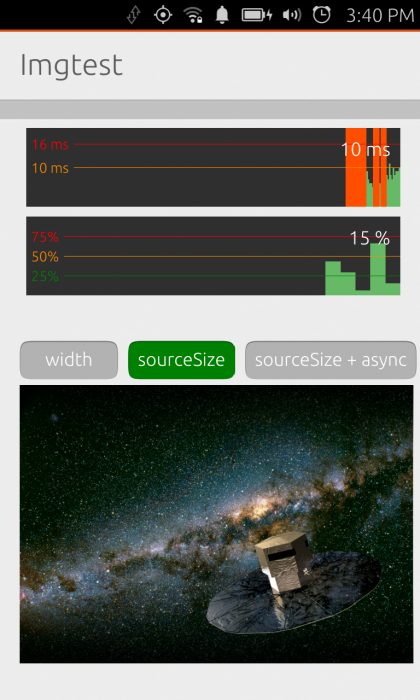
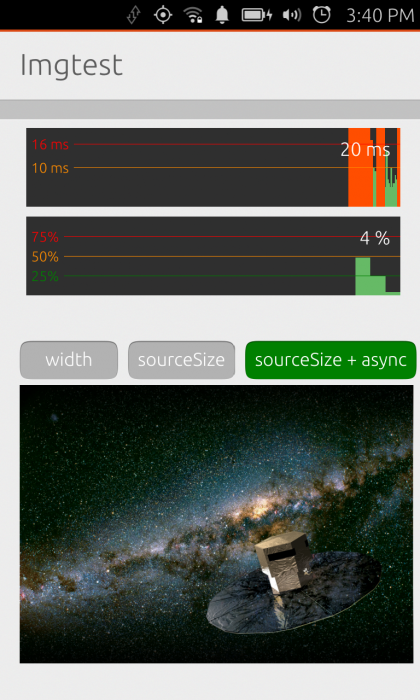
- Use sourceSize for large files: it will define the number of pixels to be stored in memory. A large image displayed at a smaller size using its sourceSize property will effectively use the memory of the smaller display size.
Image {
    source: “largefile.jpg”
    sourceSize: { width: 100; height: 100 }
    asynchronous: true
}
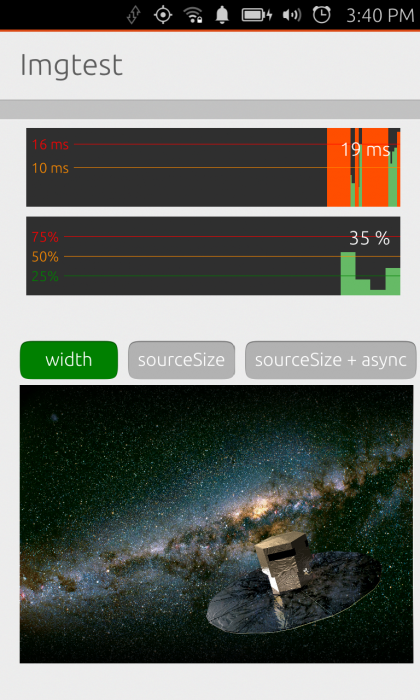
Here is a small test app showing CPU usage on a Nexus4 with various image loading parameters (35%, 15% and 4%):
- Avoid enabling the *smooth* property of images while animating them. If you really need to smooth an image, you can turn smoothing off before the animation and add it back when the animation is over.
- Prefer bitmaps. This is a sad fact of life, but vectors will load slower than bitmaps.
- Don’t clip a rotated image. Clipping is very useful to draw boundaries in your UI, but when you apply it to modified images, it becomes very expensive.
Overdraws
You should always try to prevent painting the same area of your UI several times.
- Remove hidden components. If several parts of your UI are overlapping, try to unload or remove hidden and useless components.
- Prefer Item to Rectangle. A common mistake is to use a Rectangle component as a standard UI element holder, if you don’t need an actual rectangle background, you should probably use an Item instead.
Going further
You can find more QML tips in the Qt doc and at AskUbuntu.
If you are blocked on a performance issue, come on Freenode IRC and ask the friendly developer community in the #ubuntu-app-devel channel.